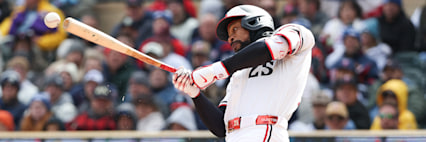

Byron Buxton
RHB18
HRs ?Total home runs hit while this batter appeared in the model's scored pool this season.
32.1%
HR Rate ?Percentage of scored appearances where this batter hit a home run. Higher = more reliable power output.
26.9%
Avg HR/FB ?Average HR-per-fly-ball rate across appearances. Measures how often fly balls leave the yard — above 16% is elite, above 12% is strong.
89.3
Avg EV ?Average exit velocity (mph) on batted balls. Hard contact is the best predictor of HR power — 92+ is elite, 89+ is strong.
0.270
ISO ?Isolated Power — measures raw extra-base-hit ability (SLG minus AVG). .220+ is elite power, .180+ is above average.
#1
Best Rank ?Highest model ranking this batter has achieved on a single slate. #1 means the model rated them the top HR candidate that day.
HR Profile
?Statcast-style HR metrics for this batter — same fields the model scores on. Red = elite, orange = above average, blue = below average, grey = no data.
Season-to-date · live-tape thresholds
0.319
ISO ?Isolated Power (SLG − AVG). >.220 elite, .180–.220 above avg, <.140 below avg.
98th pctile
90.3
Avg EV (mph) ?Average exit velocity (mph) on all batted balls. >92 elite, 89–92 above avg.
67th pctile
12.8%
Barrel% ?Percentage of contact classified as barrels (perfect EV+LA combo). >12% elite.
93th pctile
22.2% vs LHP
HR/FB ?Home runs per fly ball for this matchup. A vs LHP/vs RHP chip means a handedness split is shown; otherwise the value is overall.
88th pctile
400
Avg HR Dist (ft) ?Average distance of this batter's HRs in feet. >400 elite raw power.
65th pctile
32.1%
Season HR% ?HRs ÷ plate appearances this season. v3.5 model feature — strongest single backtest contributor.
33.3%
14d Pace ?HRs per game over last 14 days. v3.5 model feature — captures current hot/cold streak.
24.0%
Match% ?Combined batter × pitcher HR/FB rate — the headline "how favorable is this matchup" number.
95th pctile
25
BBE ?Batted-ball events — sample size. Treat stats with caution below 30.
HR Cadence ?Tracks how often this batter typically hits HRs and whether they're overdue. Based on the median gap (in games) between each HR this season. Display only — does not affect model score.
Typically goes yard every 2 games
· 18 HRs in 56 games
0×
Due (1×)
2×
0.5×
Dueness ?Games since last HR ÷ typical cadence. 1.0× = right on schedule. Above 1.0× = overdue relative to their own baseline. 1.5×+ = significantly overdue.
1
Games Since HR ?How many games (appearances in the scored pool) since this batter's last home run.
2
Typical Cadence ?Median number of games between home runs this season. Uses median (not average) for robustness against streaky outliers. Requires 3+ HRs to establish a baseline.
Games between HRs ?Each bar = the number of games between consecutive HRs. The final highlighted bar is the current gap (still open). Bars above the typical cadence are colored differently.
56
Appearances ?Total times this batter has appeared in the model's daily scored pool this season.
34
Top-50 Days ?Number of days this batter ranked in the top 50 on the slate. Top-50 is the model's primary recommendation zone.
9
HRs in Top 50 ?Home runs hit on days when the model ranked this batter in the top 50. Measures how often the model correctly surfaced this batter before they went deep.
50%
Catch Rate ?Percentage of this batter's HRs that occurred when the model had them ranked in the top 50. Higher = model does a good job timing this batter. 60%+ is excellent.
#49.8
Avg Rank ?This batter's average model rank across all appearances. Lower = the model consistently rates them highly.
Rank Trend ?Daily model rank over time. The Y-axis is inverted — lower on the chart = better rank. Green dots mark days this batter hit a home run.
HR Days (While Top 50) ?Every HR this batter hit on a day the model ranked them in the top 50. Shows the matchup conditions that led to each homer — pitcher, stadium, exit velocity, and distance.
| Date | Rank | Pitcher | Stadium | B/P | WT | BP | EV | Distance |
|---|---|---|---|---|---|---|---|---|
| 2026-04-13 | #16 | Garrett Crochet | Target Field | R/L | — | 105.4 mph | 420.0 ft | |
| 2026-04-30 | #15 | Kevin Gausman | Target Field | R/R | ⚠️ | 101.8 mph | 375.0 ft | |
| 2026-05-05 | #44 | Cade Cavalli | Nationals Park | R/R | 🔥 | 106.4 mph | 387.0 ft | |
| 2026-05-13 | #37 | Max Meyer | Target Field | R/R | ✅ | 105.2 mph | 418.0 ft | |
| 2026-05-22 | #12 | Payton Tolle | Fenway Park | R/L | 🔥 | 109.4 mph | 419.0 ft | |
| 2026-05-27 | #1 | David Sandlin | Rate Field | R/R | ⚠️ | 106.3 mph | 417.0 ft | |
| 2026-06-04 | #16 | Seth Lugo | Target Field | R/R | ⚠️ | 109.6 mph | 430 ft | |
| 2026-06-09 | #43 | Troy Melton | Comerica Park | R/R | ✅ | 111.9 mph | 428 ft | |
| 2026-06-10 | #14 | Framber Valdez | Comerica Park | R/L | ✅ | 107.0 mph | 413 ft |
All Appearances ?Complete log of every time this batter appeared on the scored slate. Includes model rank, tier, form trend, and whether they went yard. Rows highlighted in green = HR days.
| Date | Rank | Pitcher | B/P | HR/FB | Tier | Form | WT | BP | HR? |
|---|---|---|---|---|---|---|---|---|---|
| 2026-06-11 | #6 | Keider Montero | R/R * | 30.0% | 🟢 A | 📈 WARM | ✅ | · | |
| 2026-06-10 | #14 | Framber Valdez | R/L * | 23.8% | 🔵 C+ | 📈 WARM | ✅ | ||
| 2026-06-09 | #43 | Troy Melton | R/R * | 19.8% | ⚪ D | 📉 COOL | ✅ | ||
| 2026-06-05 | #6 | Michael Wacha | R/R * | 30.2% | 🟢 A | 📈 WARM | ⚠️ | · | |
| 2026-06-04 | #16 | Seth Lugo | R/R * | 23.2% | 🔵 C+ | 📉 COOL | ⚠️ | ||
| 2026-06-03 | #6 | Erick Fedde | R/R * | 32.7% | 🟢 A | 📉 COOL | ✅ | · | |
| 2026-06-02 | #31 | Davis Martin | R/R * | 23.4% | 🔵 C+ | 📉 COOL | ✅ | · | |
| 2026-06-01 | #3 | David Sandlin | R/R * | 31.3% | 🟢 A | 📈 WARM | ✅ | · | |
| 2026-05-30 | #28 | Mitch Keller | R/R * | 21.6% | 🔵 C+ | 📈 WARM | ✅ | · | |
| 2026-05-28 | #2 | Davis Martin | R/R * | 33.8% | 🟢 A | 📈 WARM | ⚠️ | · | |
| 2026-05-27 | #1 | David Sandlin | R/R * | 39.0% | 🟢 A | 📈 WARM | ⚠️ | ||
| 2026-05-26 | #3 | Sean Burke | R/R * | 36.5% | 🟢 A | 📈 WARM | ⚠️ | · | |
| 2026-05-25 | #1 | Anthony Kay | R/L * | 33.7% | 🟢 A | 📈 WARM | ⚠️ | · | |
| 2026-05-23 | #2 | Jovani Morán | R/L * | 25.8% | 🔵 C+ | 📈 WARM | 🔥 | · | |
| 2026-05-22 | #12 | Payton Tolle | R/L * | 21.5% | 🔵 C+ | 📈 WARM | 🔥 | ||
| 2026-05-20 | #1 | Mike Burrows | R/R * | 34.8% | 🟢 A | 📈 WARM | — | · | |
| 2026-05-19 | #1 | Jason Alexander | R/R * | 34.6% | 🟢 A | 🔥 HOT | ⚠️ | · | |
| 2026-05-18 | #2 | Tatsuya Imai | R/R * | 43.1% | 🔥 A+ | 🔥 HOT | ⚠️ | · | |
| 2026-05-13 | #37 | Max Meyer | R/R * | 28.4% | 🔵 C+ | 📈 WARM | ✅ | ||
| 2026-05-12 | #15 | Eury Pérez | R/R * | 40.5% | 🔥 A+ | 📈 WARM | ✅ | · | |
| 2026-05-10 | #80 | Gavin Williams | R/R * | 41.6% | 🔥 A+ | 📈 WARM | 🔥 | · | |
| 2026-05-09 | #64 | Tanner Bibee | R/R * | 29.6% | 🔵 C+ | 📈 WARM | 🔥 | ||
| 2026-05-08 | #115 | Parker Messick | R/L * | 28.8% | 🔵 C+ | ➖ NTRL | 🔥 | ||
| 2026-05-07 | #76 | Jake Irvin | R/R * | 33.3% | 🟢 A | ➖ NTRL | 🔥 | · | |
| 2026-05-06 | #111 | Miles Mikolas | R/R * | 39.1% | 🟢 A | ➖ NTRL | 🔥 | · | |
| 2026-05-05 | #44 | Cade Cavalli | R/R * | 23.7% | 🔵 C+ | 📈 WARM | 🔥 | ||
| 2026-05-02 | #134 | Dylan Cease | R/R * | 24.5% | 🔵 C+ | ➖ NTRL | ⚠️ | ||
| 2026-05-01 | #160 | Patrick Corbin | R/L * | 23.2% | 🔵 C+ | 📉 COOL | ⚠️ | ||
| 2026-04-30 | #15 | Kevin Gausman | R/R * | 33.4% | 🟢 A | 📉 COOL | ⚠️ | ||
| 2026-04-29 | #208 | George Kirby | R/R * | 30.1% | 🟢 A | 📉 COOL | ✅ | · | |
| 2026-04-28 | #103 | Logan Gilbert | R/R * | 20.6% | 🔵 C+ | 📈 WARM | ✅ | ||
| 2026-04-27 | #53 | Luis Castillo | R/R * | 20.8% | 🔵 C+ | 📈 WARM | ✅ | ||
| 2026-04-25 | #57 | Shane McClanahan | R/L | 21.4% | 🔵 C+ | 📈 WARM | 🔥 | · | |
| 2026-04-24 | #60 | Drew Rasmussen | R/R | 28.3% | 🔵 C+ | 📈 WARM | 🔥 | · | |
| 2026-04-23 | #34 | Christian Scott | R/R | 20.5% | 🔵 C+ | 📈 WARM | ⚠️ | · | |
| 2026-04-22 | #113 | Clay Holmes | R/R | 19.2% | ⚪ D | 📉 COOL | ⚠️ | ||
| 2026-04-21 | #125 | Nolan McLean | R/R | 14.2% | ⚪ D | 📉 COOL | ⚠️ | ||
| 2026-04-19 | #140 | Brady Singer | R/R | 17.3% | ⚪ D | ➖ NTRL | — | · | |
| 2026-04-18 | #121 | Andrew Abbott | R/L | 18.3% | ⚪ D | 📈 WARM | — | · | |
| 2026-04-17 | #81 | Brandon Williamson | R/L | 20.8% | 🔵 C+ | 📈 WARM | — | · | |
| 2026-04-14 | #53 | Sonny Gray | R/R | 13.2% | ⚪ D | 📈 WARM | — | ||
| 2026-04-13 | #16 | Garrett Crochet | R/L | 14.5% | ⚪ D | 📈 WARM | — | ||
| 2026-04-11 | #33 | Eric Lauer | R/L | 18.8% | ⚪ D | ❄ COLD | ✅ | · | |
| 2026-04-10 | #38 | Patrick Corbin | R/ | 19.8% | ⚪ D | ❄ COLD | ✅ | · | |
| 2026-04-09 | #20 | Jack Flaherty | R/R | 17.7% | ⚪ D | ❄ COLD | ✅ | · | |
| 2026-04-08 | #39 | Framber Valdez | R/L | 17.2% | ⚪ D | ➖ NTRL | ✅ | · | |
| 2026-04-07 | #47 | Tarik Skubal | R/L | 15.6% | ⚪ D | ❄ COLD | ✅ | · | |
| 2026-04-06 | #34 | Casey Mize | R/R | 16.6% | ⚪ D | 📉 COOL | ✅ | · | |
| 2026-04-05 | #60 | Nick Martinez | R/R | 14.3% | ⚪ D | 📈 WARM | ⚠️ | · | |
| 2026-04-04 | #64 | Steven Matz | R/L | 13.9% | ⚪ D | 📈 WARM | ⚠️ | · | |
| 2026-04-02 | #2 | Cole Ragans | R/L | 15.5% | ⚪ D | 📈 WARM | ✅ | · | |
| 2026-04-01 | #25 | Noah Cameron | R/L | 15.6% | ⚪ D | 📈 WARM | ✅ | · | |
| 2026-03-30 | #142 | Kris Bubic | R/L | 10.6% | ⚪ D | 📈 WARM | ✅ | · | |
| 2026-03-29 | #1 | Shane Baz | R/R | 23.3% | 🔵 C+ | 📈 WARM | ⚠️ | · | |
| 2026-03-28 | #10 | Kyle Bradish | · | 18.7% | ⚪ D | · — | — | · | |
| 2026-03-26 | #82 | Trevor Rogers | · | 11.2% | ⚪ D | · — | — | · |